Dropwizard metrics
The DropwizardMetrics plugin lets you configure the Metrics library to get useful information about the server and incoming requests.
Add dependencies
To enable DropwizardMetrics, you need to include the following artifacts in the build script:
Add the
ktor-server-metricsdependency:implementation("io.ktor:ktor-server-metrics:$ktor_version")implementation "io.ktor:ktor-server-metrics:$ktor_version"<dependency> <groupId>io.ktor</groupId> <artifactId>ktor-server-metrics-jvm</artifactId> <version>${ktor_version}</version> </dependency>Optionally, add a dependency required for a specific reporter. The example below shows how to add an artifact required to report metrics via JMX:
implementation("io.dropwizard.metrics:metrics-jmx:$dropwizard_version")implementation "io.dropwizard.metrics:metrics-jmx:$dropwizard_version"<dependency> <groupId>io.dropwizard.metrics</groupId> <artifactId>metrics-jmx</artifactId> <version>${dropwizard_version}</version> </dependency>You can replace
$dropwizard_versionwith the required version of themetrics-jmxartifact, for example,4.2.15.
Install DropwizardMetrics
To install the DropwizardMetrics plugin to the application, pass it to the install function in the specified module. The code snippets below show how to install DropwizardMetrics...
... inside the
embeddedServerfunction call.... inside the explicitly defined
module, which is an extension function of theApplicationclass.
Configure DropwizardMetrics
DropwizardMetrics allows you to use any supported Metric reporter using the registry property. Let's take a look at how to configure the SLF4J and JMX reporters.
SLF4J reporter
The SLF4J reporter allows you to periodically emit reports to any output supported by SLF4J. For example, to output the metrics every 10 seconds, you would:
You can find the full example here: dropwizard-metrics.
If you run the application and open http://0.0.0.0:8080, the output will look like this:
JMX reporter
The JMX reporter allows you to expose all the metrics to JMX, allowing you to view those metrics using jconsole.
You can find the full example here: dropwizard-metrics.
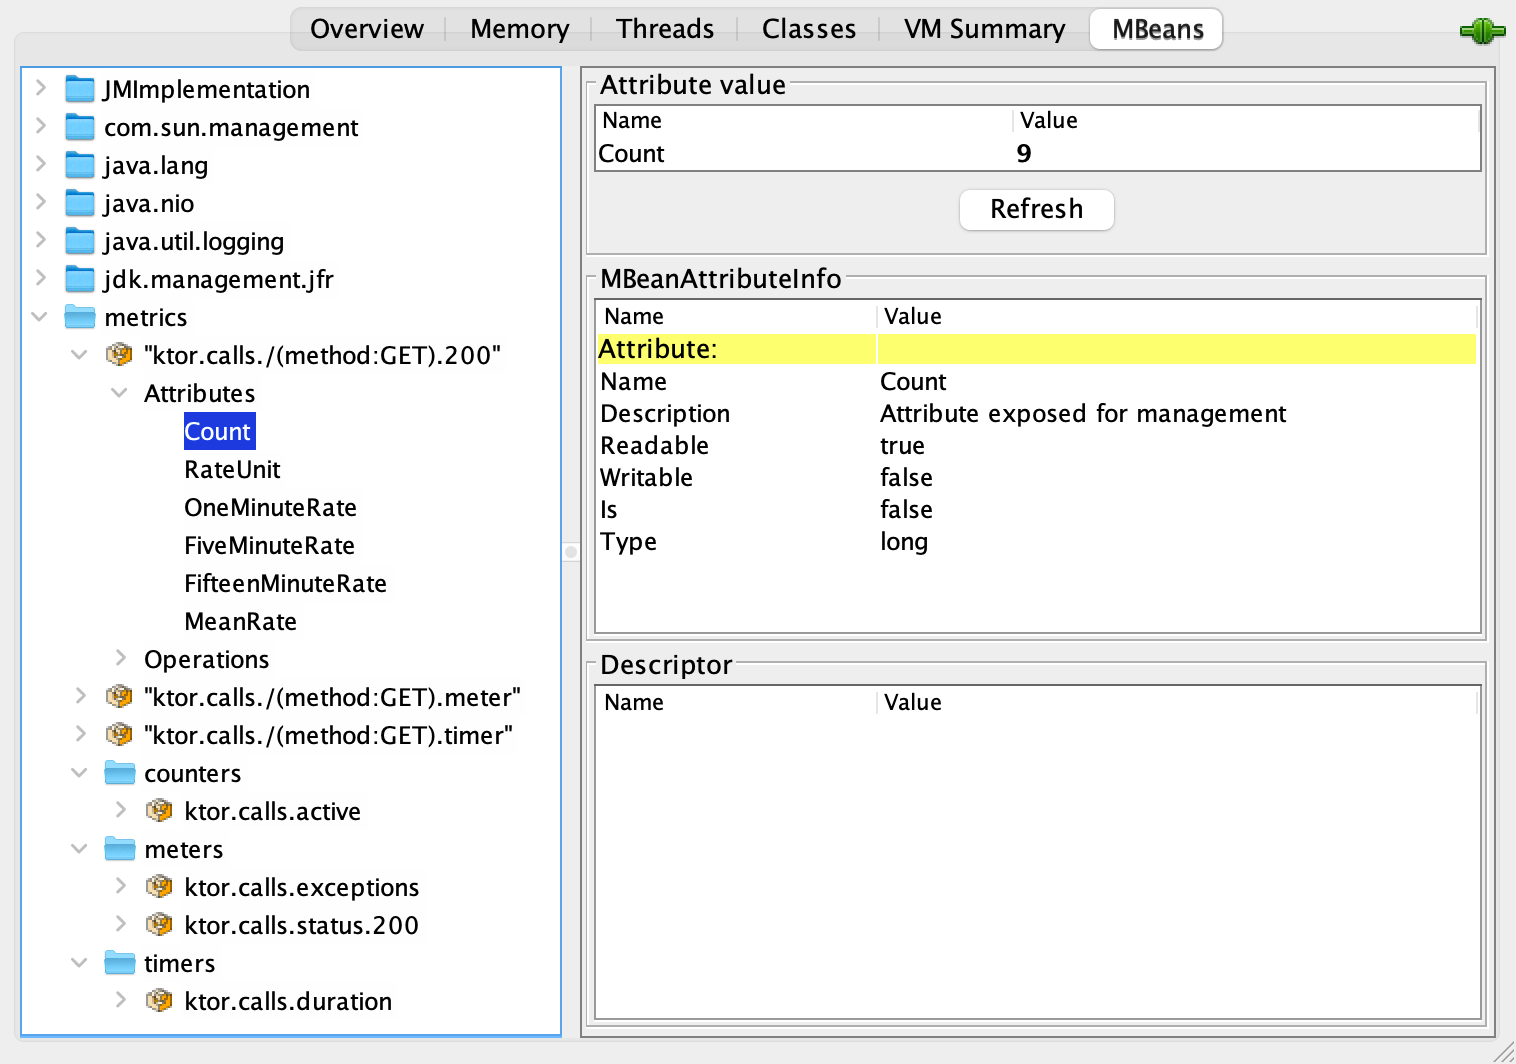
If you run the application and connect to its process using the JConsole, metrics will look like this:

Exposed metrics
DropwizardMetrics exposes the following metrics:
Global metrics that include Ktor-specific and JVM metrics.
Global metrics
Global metrics include the following Ktor-specific metrics:
ktor.calls.active:Count- The number of unfinished active requests.ktor.calls.duration- Information about the duration of the calls.ktor.calls.exceptions- Information about the number of exceptions.ktor.calls.status.NNN- Information about the number of times that happened a specific HTTP status codeNNN.
Note that a metric name starts with the ktor.calls prefix. You can customize it using the baseName property:
Metrics per endpoint
"/uri(method:VERB).NNN"- Information about the number of times that happened a specific HTTP status codeNNN, for this path and verb."/uri(method:VERB).meter"- Information about the number of calls for this path and verb."/uri(method:VERB).timer"- Information about the duration for this endpoint.
JVM metrics
In addition to HTTP metrics, Ktor exposes a set of metrics for monitoring the JVM. You can disable these metrics using the registerJvmMetricSets property:
You can find the full example here: dropwizard-metrics.