Distributed tracing with OpenTelemetry in Ktor Server
Ktor integrates with OpenTelemetry — an open-source observability framework for collecting telemetry data such as traces, metrics, and logs. It provides a standard way to instrument applications and export data to monitoring and observability tools like Grafana or Jaeger.
The KtorServerTelemetry plugin enables distributed tracing of incoming HTTP requests in a Ktor server application. It automatically creates spans containing route, HTTP method, and status code information, extracts existing trace context from incoming request headers, and allows customizing span names, attributes, and span kinds.
Add dependencies
To use KtorServerTelemetry, you need to include the opentelemetry-ktor-3.0 artifact in the build script:
Configure OpenTelemetry
Before installing the KtorServerTelemetry plugin in your Ktor application, you need to configure and initialize an OpenTelemetry instance. This instance is responsible for managing telemetry data, including traces and metrics.
Automatic configuration
A common way to configure OpenTelemetry is to use AutoConfiguredOpenTelemetrySdk. This simplifies setup by automatically configuring exporters and resources based on system properties and environment variables.
You can still customize the automatically detected configuration — for example, by adding a service.name resource attribute:
Programmatic configuration
To define exporters, processors, and propagators in code, instead of relying on environment-based configuration, you can use OpenTelemetrySdk.
The following example shows how to configure OpenTelemetry programmatically with an OTLP exporter, a span processor, and a trace context propagator:
Use this approach if you require full control over telemetry setup, or when your deployment environment cannot rely on automatic configuration.
Install KtorServerTelemetry
To install the KtorServerTelemetry plugin to the application, pass it to the install function in the specified module and set the configured OpenTelemetry instance:
Configure tracing
You can customize how the Ktor server records and exports OpenTelemetry spans. The options below allow you to adjust which requests are traced, how spans are named, what attributes they contain, and how span kinds are determined.
Trace additional HTTP methods
By default, the plugin traces standard HTTP methods (GET, POST, PUT, etc.). To trace additional or custom methods, configure the knownMethods property:
Capture headers
To include specific HTTP request headers as span attributes, use the capturedRequestHeaders property:
Select span kind
To override the span kind (such as SERVER, CLIENT, PRODUCER, CONSUMER) based on request characteristics, use the spanKindExtractor property:
Add custom attributes
To attach custom attributes at the start or end of a span, use the attributesExtractor property:
Additional properties
To fine-tune tracing behavior across your application, you can also configure additional OpenTelemetry properties like propagators, attribute limits, and enabling/disabling instrumentation. For more details, see the OpenTelemetry Java configuration guide.
Verify telemetry data with Grafana LGTM
To visualize and verify your telemetry data, you can export traces, metrics, and logs to a distributed tracing backend, such as Grafana. The grafana/otel-lgtm all-in-one image bundles Grafana, Tempo (traces), Loki (logs), and Mimir (metrics).
Using Docker Compose
Create a docker-compose.yml file with the following content:
To start the Grafana LGTM all-in-one container, run the following command:
Using Docker CLI
Alternatively, you can run Grafana directly using the Docker command line:
Application export configuration
To send telemetry from your Ktor application to an OTLP endpoint, configure the OpenTelemetry SDK to use the gRPC protocol. You can set these values via environment variables before building the SDK:
Or use JVM flags:
Accessing Grafana UI
Once running, the Grafana UI will be available at http://localhost:3000/.
Open the Grafana UI at http://localhost:3000/.
Login with the default credentials:
adminadmin
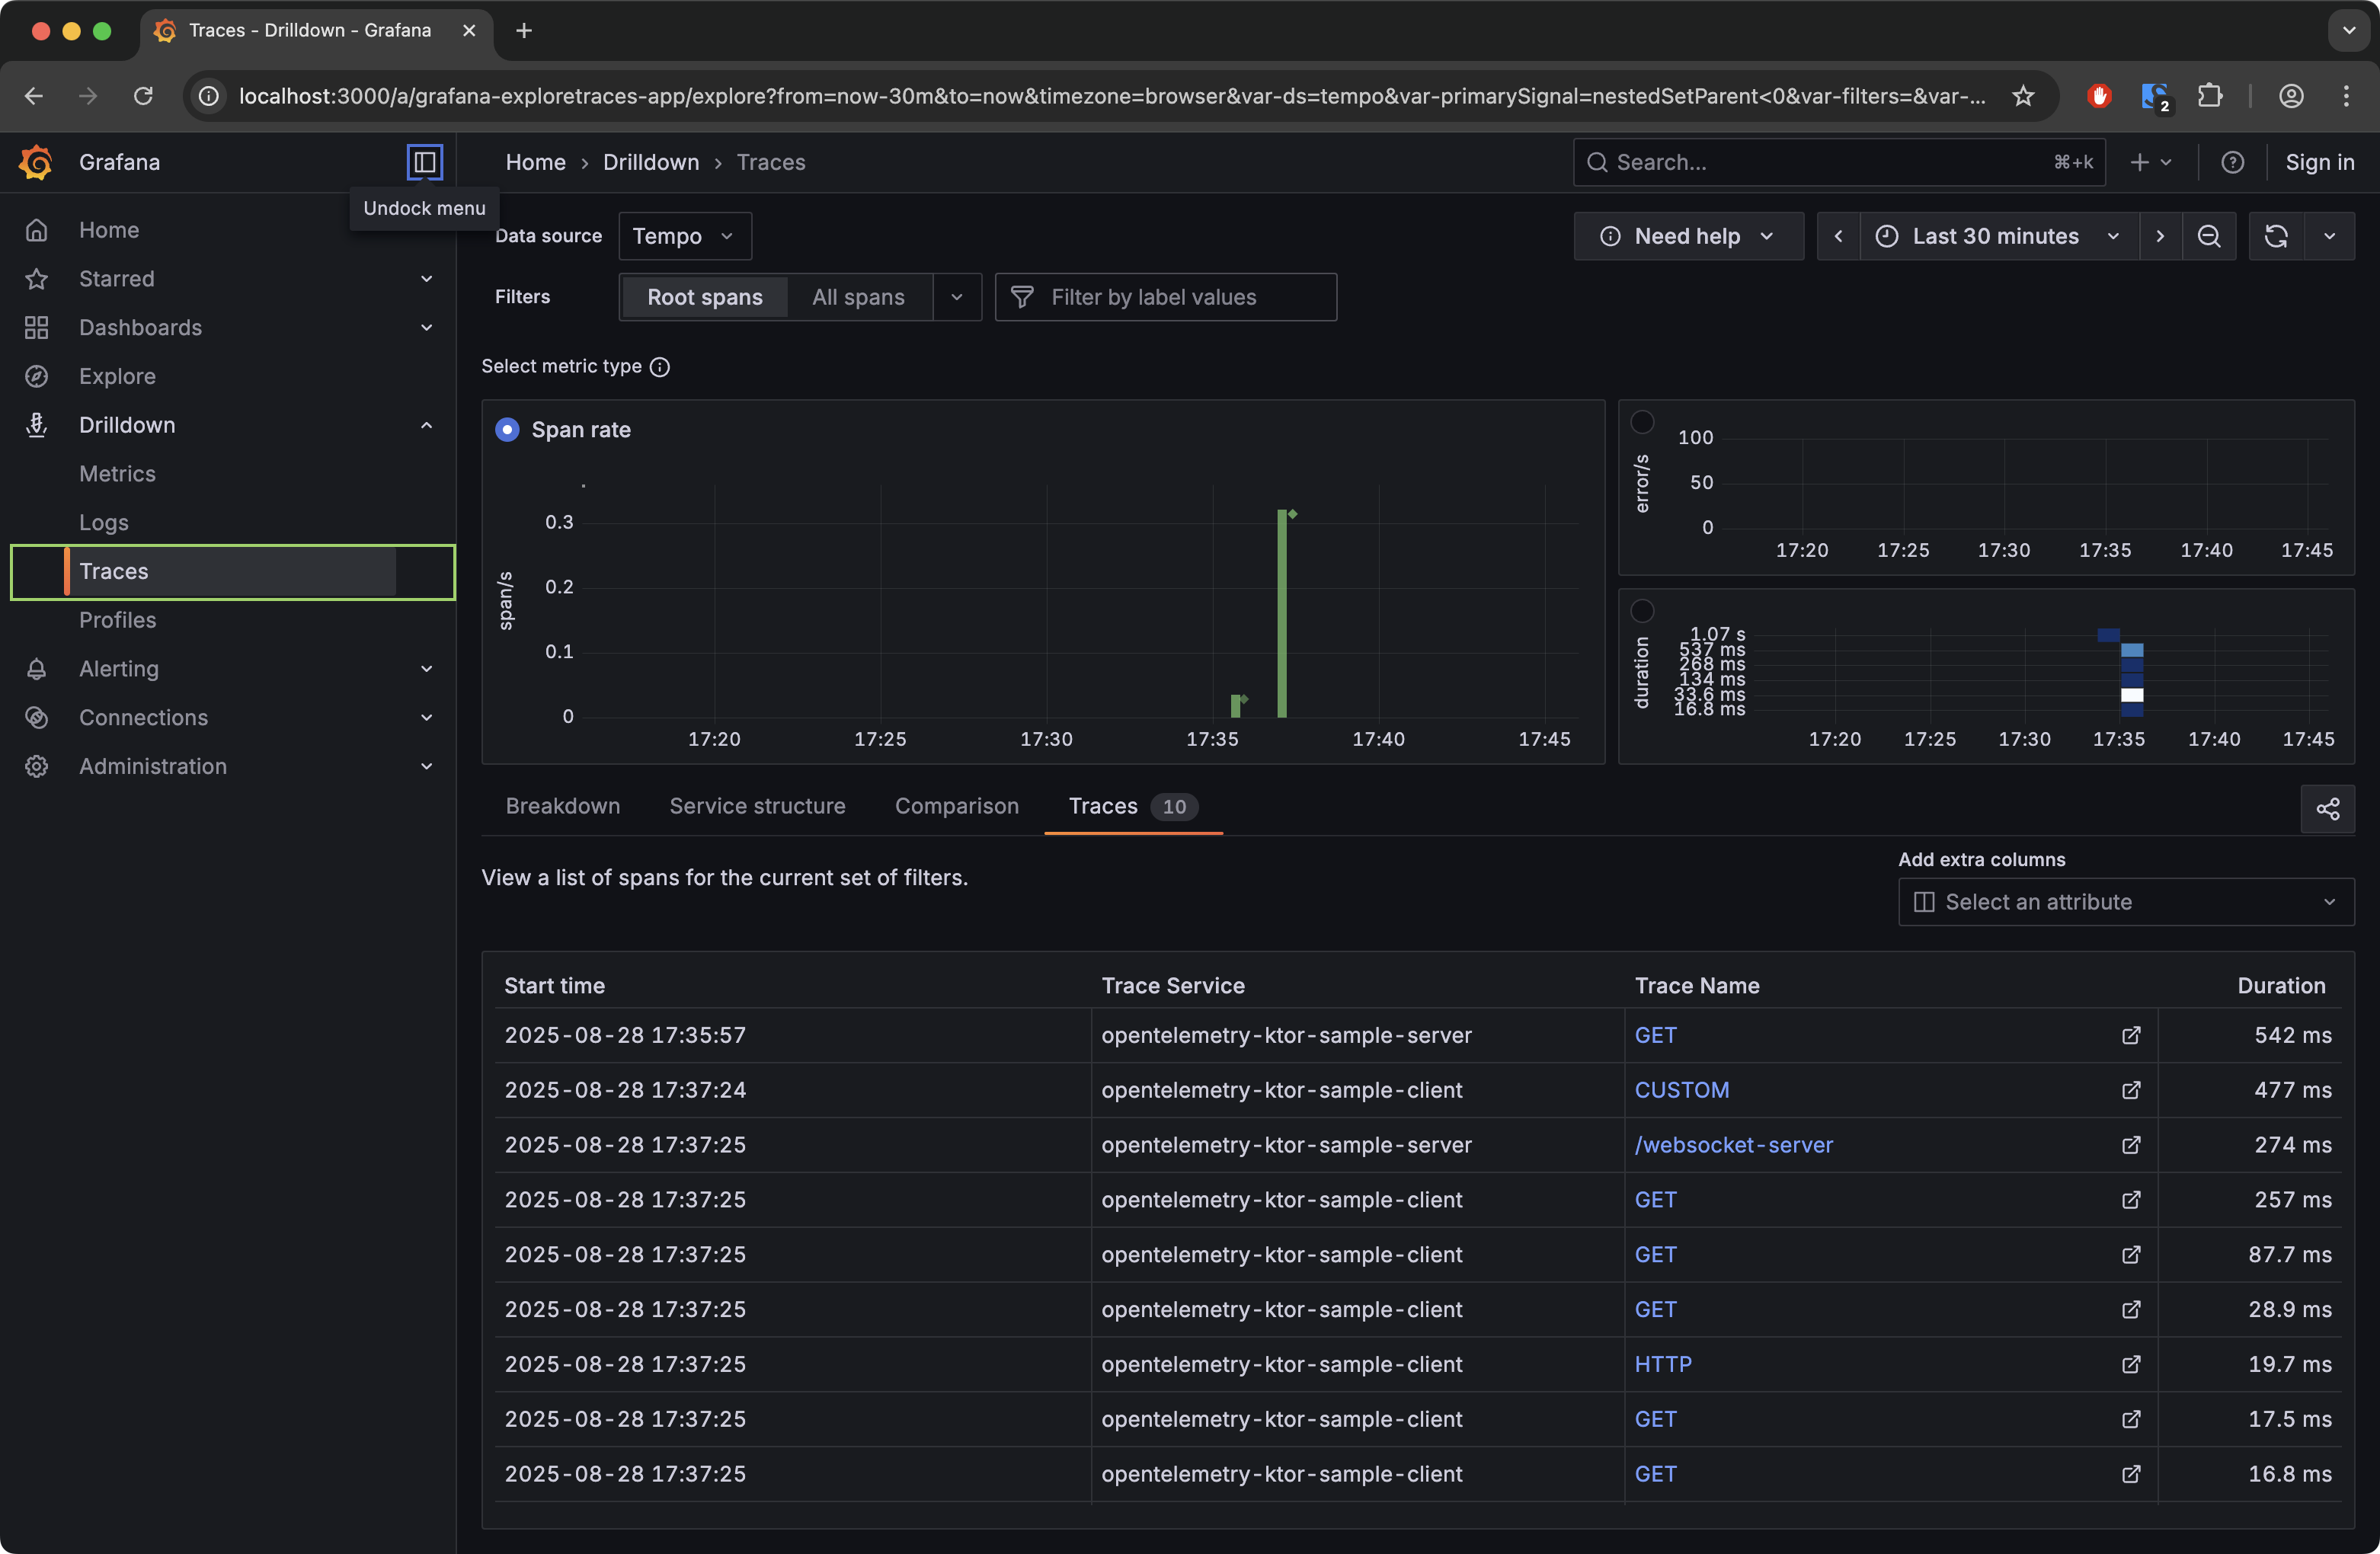
In the left-hand navigation menu, go to :

Once in the view, you can:
Select Rate, Errors, or Duration metrics.
Apply span filters (e.g., by service name or span name) to narrow down your data.
View traces, inspect details, and interact with span timelines.